【2011-2015年光收发模块市场最新预测】报告
讯石光通讯网 发布时间:2011/4/12 11:13:51 编者:iccsz
摘要:尽管近期的光通讯市场存在的一定的不确定性,但是纵观全局,2011-2015的光通讯市场增势还是可见一斑。2010年光器件和模块的销售状况也提前显示了整个市场的复苏迹象。
尽管近期的光通讯市场存在的一定的不确定性,但是纵观全局,2011-2015的光通讯市场增势还是可见一斑。2010年光器件和模块的销售状况也提前显示了整个市场的复苏迹象。
2011年年初的光器件市场销售有一定的回落,但是这种状况不会持续多久,第二季度市场将会恢复增长。
Lightcounting于2011年四月初推出了最新的市场调研报告,此预测报告重点分析了2011-2015年光收发模块市场预测,预测数据还包含了2008-2010年的诸多历史数据。
Figures
Abstract:
Despite near term uncertainty in the market, the optical communications industry is well positioned for growth in 2011-2015. Record sales of optical components and modules in 2010 are an early indication of the industry wide recovery. While growth in the optical networking equipment market lagged behind sharp increases in components sales last year, equipment sales are expected to accelerate in 2011. A slowdown in component sales reported by suppliers in early 2011 should not last for more than a quarter or two and this market will return to growth in the second part of 2011, as fluctuations in the industry supply chain even out. Lightcounting expects growth rates in the optical component market to remain higher than the networking equipment market over the next several years, since optics accounts for an increasingly larger fraction of equipment vendor cost and revenue.
The forecast report presents an analysis of infrastructure upgrades of the top ten network operators, a summary of trends in the networking equipment market and a detailed analysis of the forecast for optical components and modules. The forecast database (offered as an Excel file) includes historical data from 2008 to 2010, as well as a forecast through 2015 for optical components and modules used in Ethernet, Fibre Channel, SONET/SDH, CWDM/DWDM, wireless infrastructure, FTTx, and high performance computing applications. Historical sales data for the period from 2008 to 2010 is based on data from more than 30 transceiver vendors, including 25 vendors that shared confidential sales data with LightCounting. The market forecast out to 2015 is based on LightCounting‘s model which correlates transceiver sales with network traffic growth and projected subscribers of FTTx systems.
Executive Summary
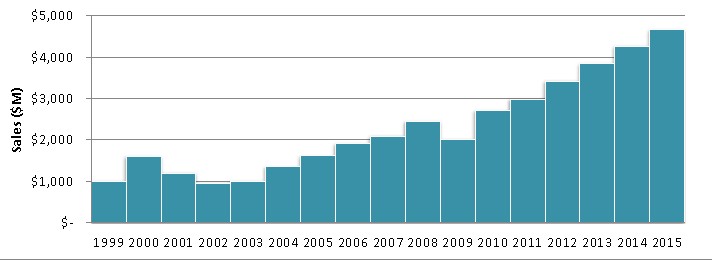
Sales of optical components and modules increased more than 35% in 2010, recovering from the market slowdown in late 2008 and early 2009. At the same time, capital expenditures (CapEx) of leading service providers increased by only 3% in 2010, while sales of optical networking equipment were flat for the year. Despite poor correlation in growth rates across the supply chain, industry momentum is positive: the 3% increase in CapEx for 2010 is an improvement from a 9% decline in 2009; flat sales in optical networking is also a step up from a 4% decline in this market in 2009. We expect global carrier CapEx and sales of optical networking equipment to resume moderate growth in 2011 driven by 4G deployments and optical infrastructure upgrades, with growth continuing through 2015. Sales of optical components and modules are expected to grow significantly faster, as illustrated by data on optical transceiver sales presented in Figure 1.
Figure 1: Global sales of optical transceivers (includes historical and forecast data)
2011年年初的光器件市场销售有一定的回落,但是这种状况不会持续多久,第二季度市场将会恢复增长。
Lightcounting于2011年四月初推出了最新的市场调研报告,此预测报告重点分析了2011-2015年光收发模块市场预测,预测数据还包含了2008-2010年的诸多历史数据。
Figures
- Figure 1: Global sales of optical transceivers (Historical data and forecast)
- Figure 2: Growth rates of network traffic and bandwidth
- Figure 3: Sales of optical transceivers used in SONET/SDH, CWDM/DWDM, FTTx and wireless networks
- Figure 4: Sales of FTTx modules, optical interconnects, and transceivers used in wireless infrastructure
- Figure 5: ITU statistics on usage of mobile and wireline services
- Figure 6: WDM transceiver unit shipments by data rate (Historical data and forecast)
- Figure 7: Shipments of 40 Gbps ports by modulation format
- Figure 8: Tunable 10-Gbps WDM transceiver unit shipments by form factor (Historical data and forecast)
- Figure 9: Sales of SONET/SDH modules by data rate
- Figure 10: Sales of OC-192 transceivers by form factor (Historical data and forecast)
- Figure 11: FTTx Transceiver unit shipments by type (Historical data and forecast)
- Figure 12: Sales of Optical Modules used in Wireless Infrastructure
- Figure 13: Sales of datacom optical transceivers by application (Historical data and forecast)
- Figure 14: 10GigE transceiver unit shipments by reach (Historical data and forecast)
- Figure 15: 10GigE unit shipments by transceiver form factor (Historical data and forecast)
- Figure 16: Ethernet transceiver unit shipments by data rate (Historical data and forecast)
- Figure 17: 40GigE and 100GigE transceiver unit shipments (Forecast)
- Figure 18: Fibre Channel transceiver unit shipments by data rate (Historical data and forecast)
- Figure 19: Optical interconnect sales by major product categories (Historical data and forecast)
Tables
- Table 1: Global Transceiver Sales Growth Forecasts per Segment
- Table 2: Characteristics of Current and Next-Generation PONs
- Table 3: Aggregated Bandwidth of Interface Modules by Market Segment (historical and forecast data)
Abstract:
Despite near term uncertainty in the market, the optical communications industry is well positioned for growth in 2011-2015. Record sales of optical components and modules in 2010 are an early indication of the industry wide recovery. While growth in the optical networking equipment market lagged behind sharp increases in components sales last year, equipment sales are expected to accelerate in 2011. A slowdown in component sales reported by suppliers in early 2011 should not last for more than a quarter or two and this market will return to growth in the second part of 2011, as fluctuations in the industry supply chain even out. Lightcounting expects growth rates in the optical component market to remain higher than the networking equipment market over the next several years, since optics accounts for an increasingly larger fraction of equipment vendor cost and revenue.
The forecast report presents an analysis of infrastructure upgrades of the top ten network operators, a summary of trends in the networking equipment market and a detailed analysis of the forecast for optical components and modules. The forecast database (offered as an Excel file) includes historical data from 2008 to 2010, as well as a forecast through 2015 for optical components and modules used in Ethernet, Fibre Channel, SONET/SDH, CWDM/DWDM, wireless infrastructure, FTTx, and high performance computing applications. Historical sales data for the period from 2008 to 2010 is based on data from more than 30 transceiver vendors, including 25 vendors that shared confidential sales data with LightCounting. The market forecast out to 2015 is based on LightCounting‘s model which correlates transceiver sales with network traffic growth and projected subscribers of FTTx systems.
Executive Summary
Sales of optical components and modules increased more than 35% in 2010, recovering from the market slowdown in late 2008 and early 2009. At the same time, capital expenditures (CapEx) of leading service providers increased by only 3% in 2010, while sales of optical networking equipment were flat for the year. Despite poor correlation in growth rates across the supply chain, industry momentum is positive: the 3% increase in CapEx for 2010 is an improvement from a 9% decline in 2009; flat sales in optical networking is also a step up from a 4% decline in this market in 2009. We expect global carrier CapEx and sales of optical networking equipment to resume moderate growth in 2011 driven by 4G deployments and optical infrastructure upgrades, with growth continuing through 2015. Sales of optical components and modules are expected to grow significantly faster, as illustrated by data on optical transceiver sales presented in Figure 1.
Figure 1: Global sales of optical transceivers (includes historical and forecast data)
内容来自:讯石光通讯咨询网
本文地址:http://www.iccsz.com//Site/CN/News/2011/04/12/20110412032224046875.htm 转载请保留文章出处
关键字: 光收发模块 预测<
文章标题:【2011-2015年光收发模块市场最新预测】报告
本文地址:http://www.iccsz.com//Site/CN/News/2011/04/12/20110412032224046875.htm 转载请保留文章出处
关键字: 光收发模块 预测<
文章标题:【2011-2015年光收发模块市场最新预测】报告
【加入收藏夹】 【推荐给好友】
免责声明:凡本网注明“讯石光通讯咨询网”的所有作品,版权均属于光通讯咨询网,未经本网授权不得转载、摘编或利用其它方式使用上述作品。 已经本网授权使用作品的,应在授权范围内使用,反上述声明者,本网将追究其相关法律责任。
※我们诚邀媒体同行合作! 联系方式:讯石光通讯咨询网新闻中心 电话:0755-82960080-188 debison
※我们诚邀媒体同行合作! 联系方式:讯石光通讯咨询网新闻中心 电话:0755-82960080-188 debison

- 设置首页 | 光通讯招聘 | 企业搜索库 | 广告服务 | 联系我们 | 保护私隐 | 公司介绍
Copyright ? 2009 ICCSZ.com Inc. All Rights Reserved. 讯石公司 www.iccsz.com版权所有 粤ICP备12008183
